Why statistics matter in licensing hearings: Looking beyond the numbers

Data plays an important role in helping licensing committees assess concerns raised at a hearing and make informed decisions about a premises licence application, variation or review. Information drawn from crime records, noise complaints and other relevant sources can help establish what is happening in an area and how closely those concerns relate to the premises being considered.
However, an increase or decrease in recorded incidents does not explain the full picture. Meaningful analysis involves examining when and where incidents occurred, how patterns change over time and whether factors such as footfall or changes in local business activity help explain the findings.
In this blog, David Oates explores how statistics can inform licensing hearings and decisions, and why Complete Licensing follows the evidence, even when findings differ from those a client hoped to see.

How do statistics help at a licensing hearing?
A licensing hearing can involve a range of accounts of how a premises operates and its effect on the surrounding area. Residents may describe disturbance, the police may raise concerns about disorder, and an operator may explain the measures they have introduced to manage these risks.
For more information about who can raise concerns and how representations are considered, read our guide to who can object to a premises licence application.
Statistical analysis helps to show whether the problems raised at a hearing form a recurring pattern, are concentrated at particular times or locations, or reflect wider changes in the area. It can also help to assess whether the measures put in place by an operator have resulted in an improvement.
The findings should help explain how the concerns relate to one or more of the four licensing objectives:
● The prevention of crime and disorder
● Public safety
● The prevention of public nuisance
● The protection of children from harm
Statistics form part of the evidence considered alongside witness accounts, CCTV, operational records and observations. Their purpose is to help the committee assess the explanations being offered and reach an informed decision on the individual case.
For operators and their advisers, this means understanding the information behind a concern, testing assumptions and clearly explaining what the evidence supports and what it cannot establish.
Where the interpretation of data is disputed, our premises licence expert witness reports and hearing evidence can help explain the findings, test assumptions and clarify how the information relates to the premises.
Looking at patterns over time
Comparing this year’s figures with last year’s can highlight a change, but it doesn’t explain whether that change is part of a longer-term trend, a seasonal pattern or an unusual period of activity.
Where records are available, a detailed analysis can examine:
● Monthly data for the previous two years which allows for a comparison of seasonal patterns and help to identify when changes began.
● Yearly data for the last decade to understand longer-term trends
● Weekly data across 52 weeks to explore fluctuations around holidays, events and trading periods.
● Daily data for at least 90 days to examine recent activity in greater detail.
This data provides a useful starting point for a case, however the approach needs to reflect the question being considered and the availability and quality of the information.
Looking at data across a range of time periods helps to establish whether a headline increase reflects a sustained problem or a short-term change that requires further explanation.
Selecting the data that matters
An overall crime total may include incidents with little connection to the premises or activities being considered. To understand what the figures mean, the analysis needs to examine the types of incidents, when they occurred and their locations.
An incident recorded nearby does not automatically demonstrate a connection to the premises. Equally, an incident outside the building may still be relevant where the evidence connects it to customers arriving or leaving.
Choosing the relevant records help to reduce background ‘noise’ that could lead to misleading conclusions. However, the criteria must be explained and applied consistently. Records should never be excluded simply because they do not support the outcome someone hoped to see.
What types of data can inform a licensing hearing?
A balanced assessment during a licensing hearing can draw on several relevant sources of information together. Crime and anti-social behaviour records are important but don’t necessarily capture every aspect of how an area operates.
Crime and anti-social behaviour
Police records are useful for identifying the types, locations and timings of incidents. Looking at these details can help to determine whether problems are concentrated around certain streets, activities or trading periods.
However, it’s important to consider that recorded incidents are influenced by reporting and recording practices. Changes in police presence or people’s willingness to report problems can affect the figures, so these possibilities also need to be considered when interpreting a trend.
Footfall and population data
The number of people using an area can provide important context during a licensing hearing. If visitor numbers increase, a rise in recorded incidents may need to be considered alongside this change. Where the measures are reliable and comparable, examining incidents related to footfall can provide another perspective.
This doesn’t make the incidents themselves less relevant but it helps to distinguish changes in the volume of activity from changes in the rate of recorded problems.
Resident population figures can also be useful, but they may not fully reflect a town centre that attracts large numbers of visitors, commuters or evening customers.
Premises density and the mix of businesses
Mapping licensed premises within a certain area can reveal the concentration and mix of business types. It can help to distinguish between premises selling alcohol for consumption on site and those selling it for consumption elsewhere.
The number of licences alone does not show exactly how an area operates. Venue capacity, opening hours, customer numbers and the nature of the businesses also matter.
An area dominated by restaurants can have a different pattern of activity in comparison to one containing late night venues, takeaway businesses and transport hubs. Understanding that mix helps explain when and where people gather and move through the area.
Public health information
Ambulance call outs, emergency department attendances and relevant hospital admissions may reveal harm that is not fully captured in police records. However, the connection to a licensing issue still needs to be explained. Area-wide health statistics cannot, on their own, establish that a particular premises caused a problem.
Noise, litter and other environmental information
Noise complaints, litter reports and environmental health records can help to build a better picture of public nuisance. The details are important here. Several complaints may relate to one event, while a smaller number may describe a recurring problem over many months. The analysis should distinguish between the number of reports and the number of separate incidents.
Times, locations and the nature of the complaint help establish whether the information relates to the premises or to wider activity in the area.
Road traffic incidents and transport activity
Where relevant, road traffic collision records and information about pedestrian movements, taxi queues or transport services can add context to public safety concerns.
For example, an assessment may need to consider what happens when customers leave several premises at similar times and gather near a busy road. These sources should be included because they can help to answer a specific question, rather than simply because the information is available.
Bringing the evidence together
The most useful data analysis considers how the different sources relate to each other. For example, a rise in incidents on a particular street may coincide with increased footfall, and change in the mix of businesses or a major event. Ambulance records may identify a pattern that is less apparent in police data. Noise complaints may cluster around a different time from recorded disorder.
These findings help develop an explanation, but they do not automatically establish cause and effect. Events occurring at similar times may be connected, or they may have separate explanations.
A clear assessment distinguishes between:
● What the records show
● What the combined evidence reasonably suggests
● What remains uncertain or cannot be established
That distinction helps those involved in a hearing understand both the value and the limits of the analysis.
Using performance oversight to assess changes
Data analysis can also help examine whether measures introduced at a premises are working. An operator may change staffing arrangements, introduce a new dispersal procedure or alter how queues are managed. Reviewing relevant information before and after those changes can help assess what happened next.
However, a reduction in incidents after a change does not, on its own, prove that the measure caused the improvement. Seasonal changes, customer numbers and activity elsewhere in the area may also have played a part.
Ongoing monitoring allows operators and advisers to test whether an improvement continues, identify emerging concerns and consider whether further action is needed. This makes analysis useful beyond the hearing itself. It can support a continuing assessment of how premises operate and how risks are being managed.
Presenting statistics clearly at a licensing hearing
Even a detailed analysis loses value if the findings are difficult to follow during a hearing.
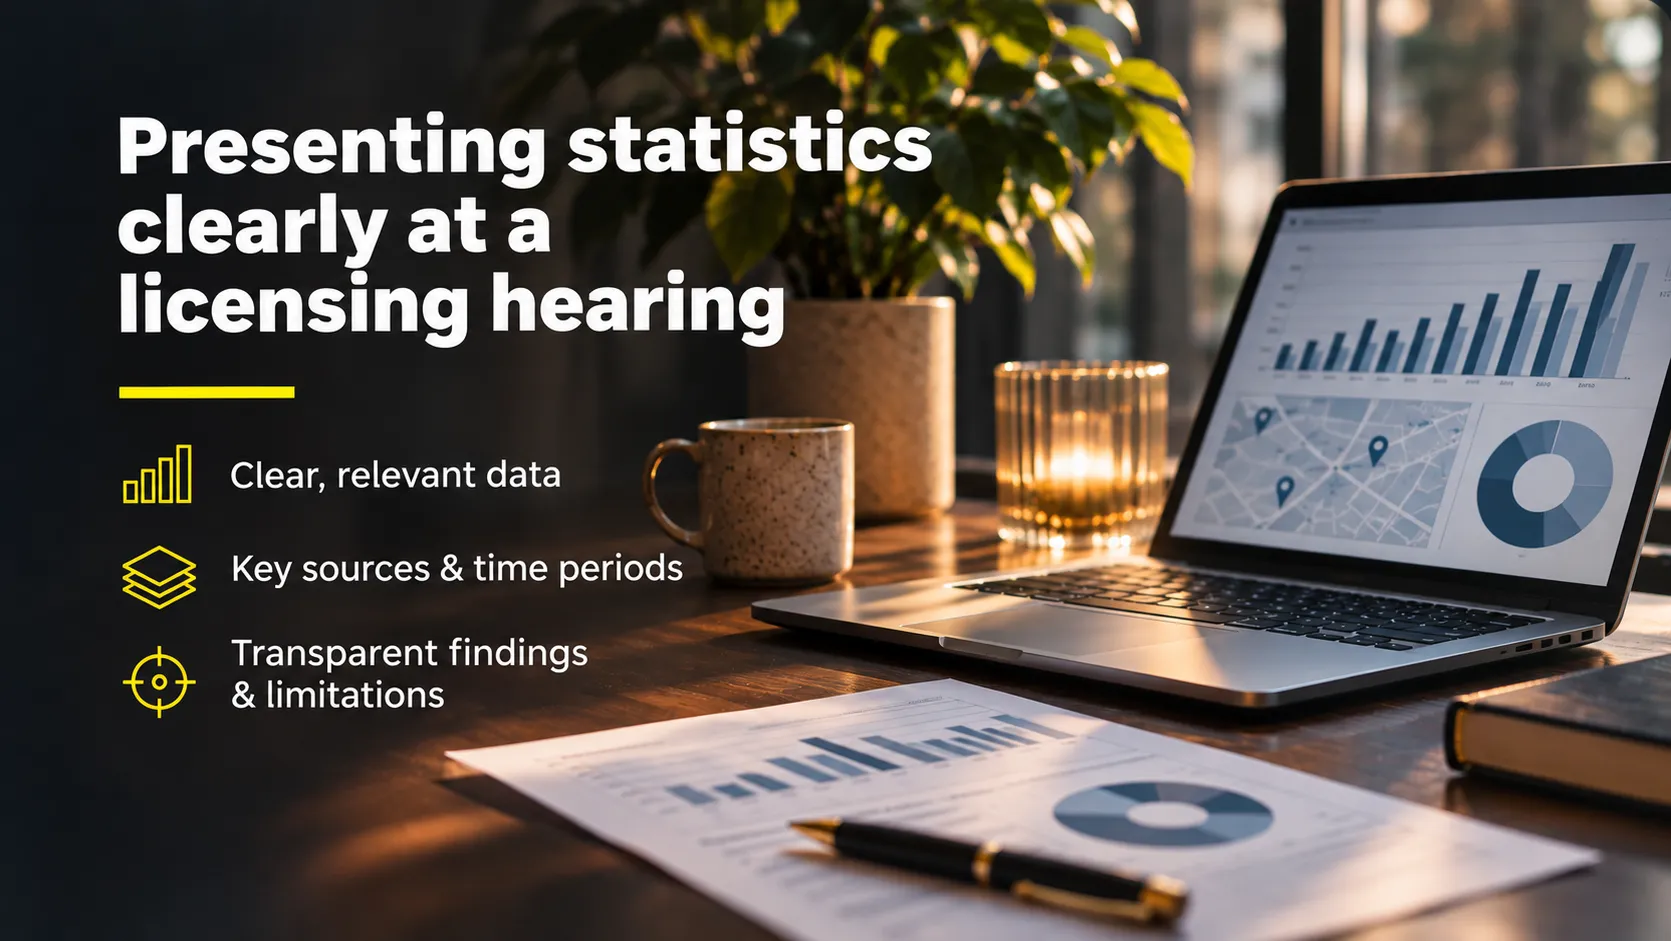
Charts, maps and tables should help explain the evidence with clear labels, consistent time periods and an explanation of where the information came from.
A report should make it possible to understand:
● The question the analysis is addressing
● The sources and periods covered
● How relevant records were selected
● Any gaps, changes in recording or other limitations
● The findings and the conclusions they support
Raw numbers should accompany percentages where useful, and changes in geographical boundaries or incident categories should be made clear. The purpose is to make the evidence understandable and open to scrutiny.
Following the evidence, even when it challenges expectations
At Complete Licensing, the most important principle is that the findings determine the account we present.
A client may expect the data to show that concerns are overstated. It may instead reveal a persistent problem that needs attention. Equally, an apparent rise in incidents may look different once timing, location and wider activity are examined.
Our role is to explain those findings honestly. That includes acknowledging uncertainty and identifying evidence that does not support the original position.
Statistics can help tell the story of an area, but that story must remain grounded in the records and their limitations. Selecting only the figures that support a preferred outcome undermines the value of the analysis.
How Complete Licensing can help
Complete Licensing uses statistics, data analysis and performance oversight to help operators and their advisers understand the evidence relevant to licensing applications, reviews and hearings.
We examine patterns over time, assess the relevance of individual data sources and explain how the findings relate to the premises and concerns being considered.
Whether the evidence supports your existing understanding or identifies issues that need further attention, we provide a clear assessment to help you consider your next steps.
Contact Complete Licensing to discuss how data analysis could inform your licensing matter.